
Student Target & Analysis System
Upload a class marks spreadsheet and get instant rankings, per-student dashboards, at-risk flags and printable target reports — offline, private, and header-language independent.
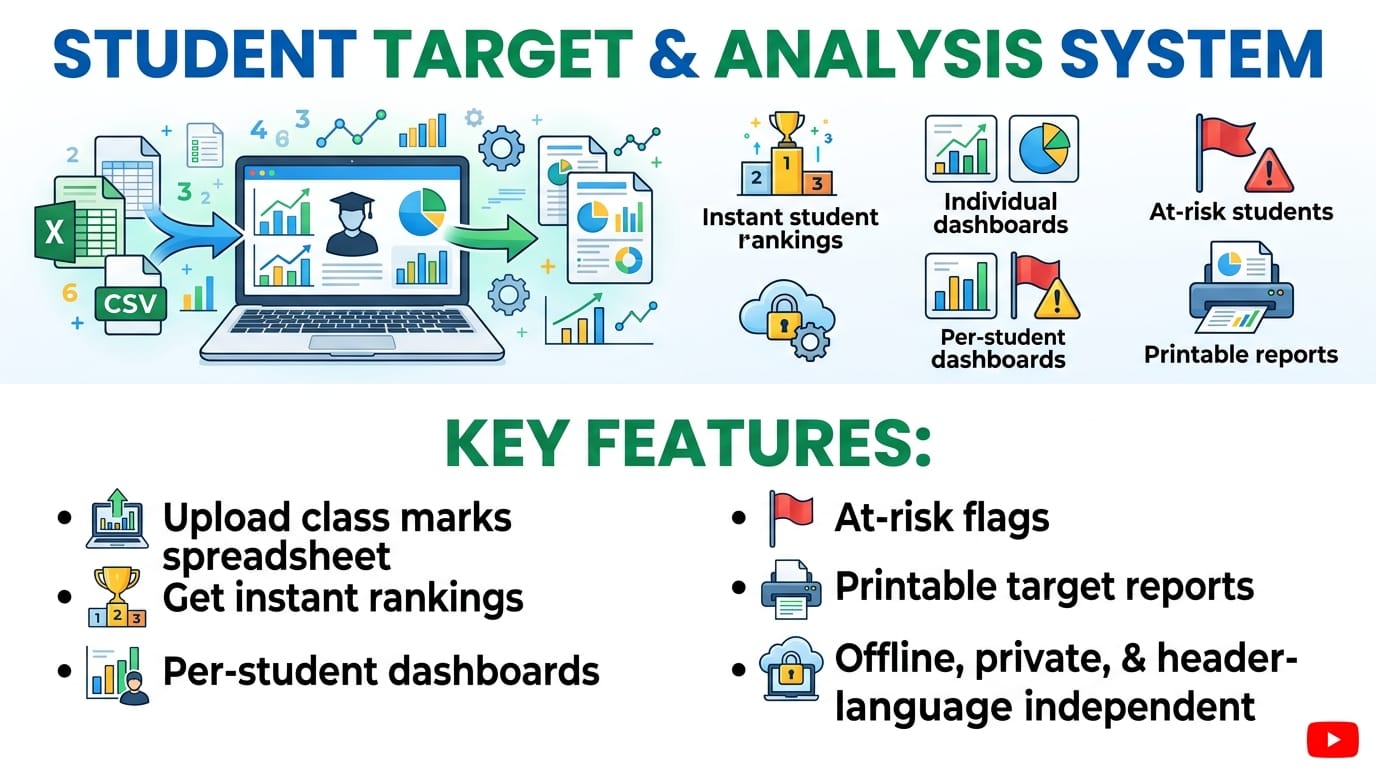
Table of Contents
Student Target & Analysis System
Turn a class marks spreadsheet into rankings, per-student dashboards, at-risk alerts and printable target reports — right in your browser, offline and free. Built for teachers, tutors and coordinators anywhere in the world.
Grading Bounds
Target Marks
Only students who score at or above the marks entered here receive the next target grade. If they score lower, their current grade stays as the target.
Upload Excel Mark Sheet
Excel Format Error!
The data in the uploaded file could not be recognised correctly. Please open the file, make the changes below, and upload it again:
- Keep a single header row only: Subject names must sit in one row. Remove any headers built from merged cells.
- Delete unnecessary columns: Remove calculated columns such as Total, Average and Rank from the Excel file. (The system computes these automatically.)
- The student-name column must be headed "Name" at the top (headers in any language are auto-detected).
Student Data Analysis
Name
Your effort and dedication will make you outstanding.
| Subject | Marks | Grade | Target | Marks Needed |
|---|
Whole-Class Summary Report
Summary Categories
Category Distribution by Subject
Extended Skills & Progress Report
Simple Ranking Table & Graphs
Top 10 Students
Overall Grade Distribution
At-Risk Students
Subject Analysis
Target Group Filter
🟢 At-risk early warning
The tool scans every student and flags anyone with too many failed subjects or absences, so struggling students surface before an exam — not after the results come out.
🔵 Class + student views together
One upload produces a per-student dashboard, a whole-class summary, ranked lists and subject-by-subject breakdowns with distribution charts. No formulas to write.
🟣 Target groups you can act on
Filter students by a rule — for example “3+ credits but weak in one subject” — then export the group to Excel or PDF, or print a clean report for a meeting.
🟢 Four steps from a marks sheet to a decision
- Set parameters (Tab 1: Parameters). Enter your grade boundaries and the target marks. A student who reaches the target is given the next grade as a goal; below it, their current grade stays the goal.
- Upload marks (Tab 2: Upload Data). One header row of subject names and a column headed “Name” (any language). Skip pre-made Total, Average or Rank columns.
- Read the analysis (Tabs 3–8). Move through Dashboard, Summary, Extended List, Simple Ranking, At-Risk and Subject Analysis to see the class from every angle.
- Filter and export (Tab 9: Target Filter). Pull out the exact group you want to support, then export to Excel, PDF, or print.
🔴 What a marks sheet hides until you sort it
A raw column of totals answers “who scored what”, but not the questions a teacher actually acts on: who is one credit short of a pass set, which subject is dragging the class down, and who is quietly slipping toward failing several subjects. This student result analysis tool takes the spreadsheet you already keep and answers those questions in a few clicks, entirely inside your browser. Nothing is uploaded to a server, so a class list never leaves your device.
🟡 Where teachers actually use it
🔵 After a term test. Drop in the marks the evening results are entered, and the Summary tab shows the pass rate and grade spread while At-Risk lists the students who need a conversation the next morning.
🟠 Before a parent meeting. Open one student in the Dashboard, print the current-vs-target grade sheet, and walk into the meeting with a clear, specific target instead of a vague “must do better”.
🟣 Planning a remedial group. Use the Target Filter to find, say, every student with at least three credits who is weak in one subject — a ready-made group for focused after-school support. This is the kind of quick, low-stakes formative assessment that changes what you teach next week.
🟢 A real run: 38 students, one upload
Take a class of 38 with marks in six subjects. You export the sheet from your record book, delete the Total and Rank columns, and upload it. In seconds the Summary shows a 71% pass rate; the Simple Ranking chart shows most students clustered in the C–S band; At-Risk flags five students carrying three or more W grades; and the Target Filter, set to “average 45–55”, surfaces eight borderline students who are a single strong paper away from a better grade set. That is the difference between a page of numbers and a plan for the week.
🟡 Mistakes that cause an “Excel Format Error”
🔵 Merged title cells. A big merged heading across the top confuses the header reader — keep a single, plain header row.
🟠 Calculated columns left in. Total, Average and Rank columns clash with the tool’s own maths; delete them before uploading (the tool recomputes everything).
🟣 No name column. The student names must sit under a header the tool can recognise — “Name” or the same word in your language.
🔴 What this tool does not do
It reads Excel files (.xlsx / .xls), not a live Google Sheets link — export first. It does not store your class between visits: that is deliberate, since the data stays private on your device, so keep your source spreadsheet. And it trusts the grade boundaries you enter in Tab 1 — the grading logic is only as right as those numbers. For more tools like this, see the free teacher tools directory, and if you want the maths behind the ranking and averages, read how student analysis tools work.
Last updated: August 2026 · Guide by Ruwan Mangala Suraweera, ICT Educator & Founder, School ICT.
🟢 Frequently asked questions
Is my student data uploaded anywhere?
No. Every calculation runs in your browser with client-side JavaScript, so marks stay on your own device.
What files can I upload?
Standard Excel files, .xlsx or .xls. They are read with the open-source SheetJS library.
Do my column headers have to be in English?
No. The header reader recognises name, index and total-type columns in several languages and scripts, so you can upload your sheet as it is.
How does it decide who is “at risk”?
It counts failed subjects (W grades) and absences against a threshold and flags students who cross it, so you can step in early.
Can I set my own grade boundaries?
Yes. Tab 1 lets you define the grade bounds and target marks, so the tool fits your own grading scheme.
Will it remember my class next time?
No, and that is by design for privacy. Re-upload your spreadsheet each session, or keep the exported Excel/PDF report.
Can I use it for O/L, A/L, GCSE or AP grading?
Yes. Any marks dataset works because you set the boundaries and targets yourself in Tab 1.
I get an “Excel Format Error” — how do I fix it?
Use a single header row, remove merged-cell titles and any Total/Rank columns, and make sure the name column is present. Then upload again.